
A primary activity of NYKids is to conduct research and identify promising practices in odds-beating schools.
Results of each study are available in multiple formats and include reports that summarize the results of each study; best practice frameworks that offer comparisons of higher- and typically-performing schools and sample documents from the odds-beating performers; and case studies of the individual higher-performing, odds-beating schools studied.
Apply Any Combination of Filters to Refine Your Results
Filters
Search Results (195)
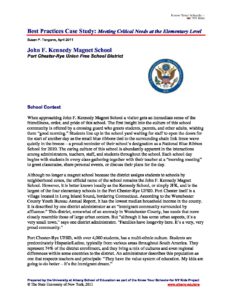
A case study report from an investigation of 13 high schools; eight of these schools had consistently higher than predicted graduation rates among at least two critical needs groups and five consistently achieved average graduation rates, given their student demographics.
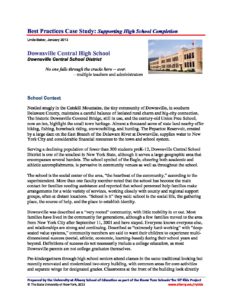
This case study is one of a series of studies conducted by Know Your Schools~for NY Kids since 2005. In 2012-13, research teams investigated 13 high schools; eight of these schools had consistently higher than predicted graduation rates among at least two critical needs groups and five consistently achieved average graduation rates, given their student demographics. Schools were selected based on the four-year graduation rates for cohorts of 2004, 2005, and 2006, as reported on their state report cards in 2009-11. Researchers used site-based interviews of teachers and administrators, as well as analyses of supportive documentation, to determine differences in practices between higher- and average-performing schools in the sample.
This presentation describes the COMPASS process. The process involves harnessing the research generated through the NYKids project for the purpose of school improvement.
This presentation describes the COMPASS process. The process involves harnessing the research generated through the NYKids project for the purpose of school improvement. Schools participate in COMPASS Institutes and utilize COMPASS tools. COMPASS stands for: (1) COMPare practices to higher performance; (20 Assess priorities; (3) Select potential levers to improve; and (4) Set Smart goals.
This presentation describes the school improvement process and tools connected to the NYKids research studies.
This presentation describes the school improvement process and tools connected to the NYKids research studies.
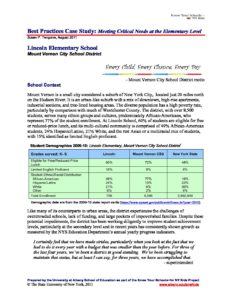
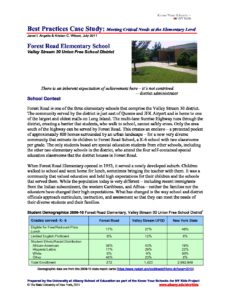
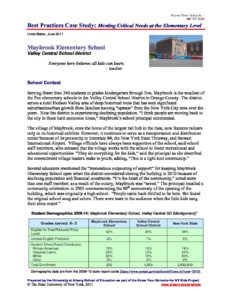
This article describes the work of the NYKids project to identify factors explaining higher performance among critical needs elementary students. Critical needs students include those with special needs and English Language Learners, as well as those living in poverty and students from traditionally disadvantaged racial backgrounds.
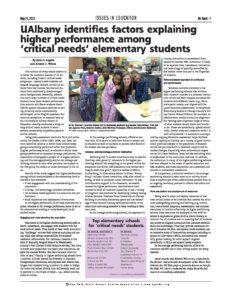
This article describes the work of the NYKids project to identify factors explaining higher performance among critical needs elementary students. Critical needs students include those with special needs and English Language Learners, as well as those living in poverty and students from traditionally disadvantaged racial backgrounds. Results of study suggest factors include: (1) close engagement with and understanding of students; (2) literacy- and technology-enriched instruction; (3) an evidence-based approach to curriculum and performance; and (4) fluid adaption and deployment of resources.
This presentation provides an overview of the ongoing NYKids project. The mission of the project is to inform, inspire and improve by providing research in support of school improvement efforts.
This presentation provides an overview of the ongoing NYKids project. The mission of the project is to inform, inspire and improve by providing research in support of school improvement efforts.
This presentation presents findings from the NYKids project on higher-performing secondary schools as measured by the school’s record of educating vulnerable young people such as those living in poverty.
This presentation presents findings from the NYKids project on higher-performing secondary schools as measured by the school’s record of educating vulnerable young people such as those living in poverty. Across all levels- elementary, middle, high – higher-performing students come from schools with the capacity for continuous improvement. These schools do this through: (1) distributed leadership; (2) collaborative culture and practices; (3) evidence-based decision making; and (4) shared vision and goal setting.
This presentation describes the best practices used by schools in working with critical needs students. These practices include: (1) close engagement with and understanding of young people with critical needs; (2) literacy-and technology-enriched instruction; and (3) fluid adaptation and deployment of resources.
This presentation describes the best practices used by schools in working with critical needs students. These practices include: (1) close engagement with and understanding of young people with critical needs; (2) literacy-and technology-enriched instruction; and (3) fluid adaptation and deployment of resources.
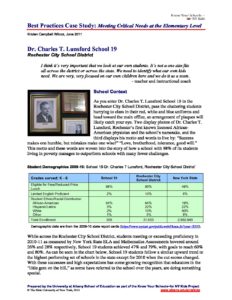
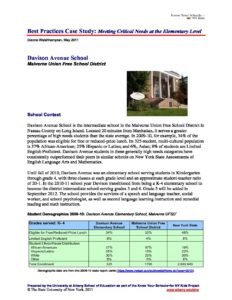
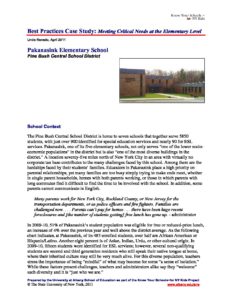
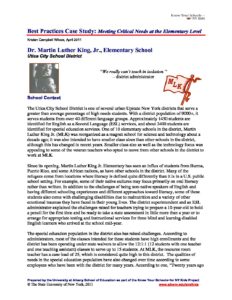
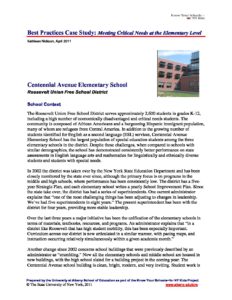
For the study of critical needs elementary schools, conducted during the 2010-11 school year, research teams investigated ten consistently higher-performing and five consistently average-performing elementary schools.
This case study is one of a series of studies conducted by Know Your Schools~for NY Kids since 2005. For the study of critical needs elementary schools, conducted during the 2010-11 school year, research teams investigated ten consistently higher-performing and five consistently average-performing elementary schools. Schools were selected based on the performance of critical needs subgroups – African American, Hispanic, English language learners, and special education students, and students living in poverty as measured by eligibility for free or reduced-price lunch – on New York State Assessments of English Language Arts and Mathematics for grades 3 through 4, 5, or 6 in 2007, 2008, and 2009.
This case study is part of an investigation of critical needs elementary schools during the 2010-11 school year.
This case study is one of a series of studies conducted by Know Your Schools~for NY Kids since 2005. For the study of critical needs elementary schools, conducted during the 2010-11 school year, research teams investigated ten consistently higher-performing and five consistently average-performing elementary schools. Schools were selected based on the performance of critical needs subgroups – African American, Hispanic, English language learners, and special education students, and students living in poverty as measured by eligibility for free or reduced-price lunch – on New York State Assessments of English Language Arts and Mathematics for grades 3 through 4, 5, or 6 in 2007, 2008, and 2009.
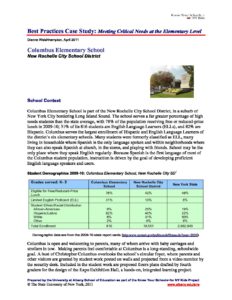
Evidence indicates that collaboration is one of the keys to a school’s success in improving student performance and closing achievement gaps, though policymakers at the national and state levels, including New York, are moving toward teacher evaluation systems that attempt to attribute student progress to the efforts of individual teachers.
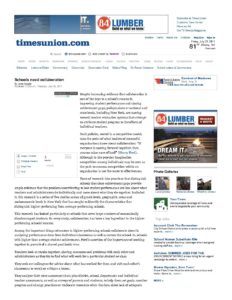
Evidence indicates that collaboration is one of the keys to a school’s success in improving student performance and closing achievement gaps, though policymakers at the national and state levels, including New York, are moving toward teacher evaluation systems that attempt to attribute student progress to the efforts of individual teachers.
This case study is part of an investigation of critical needs elementary schools during the 2010-11 school year.
This case study is one of a series of studies conducted by Know Your Schools~for NY Kids since 2005. For the study of critical needs elementary schools, conducted during the 2010-11 school year, research teams investigated ten consistently higher-performing and five consistently average-performing elementary schools. Schools were selected based on the performance of critical needs subgroups – African American, Hispanic, English language learners, and special education students, and students living in poverty as measured by eligibility for free or reduced-price lunch – on New York State Assessments of English Language Arts and Mathematics for grades 3 through 4, 5, or 6 in 2007, 2008, and 2009.
This presentation shares findings on collaborative conversations essential for middle-level success. The three essential components for trust include a climate of respect and trust, structures to support it, and an expectation of collaboration.
This presentation shares findings on collaborative conversations essential for middle-level success. The three essential components for trust include a climate of respect and trust, structures to support it, and an expectation of collaboration.
School improvement practices for middle schools.
School improvement practices for middle schools. The presentation offers best practice research findings – where they came from and how the research was conducted. Additionally, it provides other free resources to inform continuous school improvement efforts in the future.
This presentation discusses the best practice research findings from a study of middle schools. It also offers free resources to inform continuous school improvement efforts in the future.
This presentation discusses the best practice research findings from a study of middle schools. It also offers free resources to inform continuous school improvement efforts in the future.
This presentation shares research from NYKids on the importance of collaboration in middle school settings.
This presentation shares research from NYKids on the importance of collaboration in middle school settings.
This is a case study investigating middle school science conducted in the 2008-2009 school year.
This case study was conducted in spring 2009 as one of a series of studies conducted by Just for the Kids~New York since 2005. For the study of middle school science, research teams investigated seven consistently higher-performing and three average-performing schools based on student performance on the New York State Intermediate-Level Science Examination in 2006, 2007, and 2008. Researchers used site-based interviews of teachers and administrators, as well as classroom observations and analyses of supportive documentations, to determine differences in practices between higher- and average-performing schools in the sample.