
A primary activity of NYKids is to conduct research and identify promising practices in odds-beating schools.
Results of each study are available in multiple formats and include reports that summarize the results of each study; best practice frameworks that offer comparisons of higher- and typically-performing schools and sample documents from the odds-beating performers; and case studies of the individual higher-performing, odds-beating schools studied.
Apply Any Combination of Filters to Refine Your Results
Filters
Search Results (195)
A systematic examination of the ways a variety of schools have approached and responded to the Common Core Learning Standards (CCLS) and the Annual Professional Performance Review (APPR) systems, both part of the Race to the Top reform agenda.
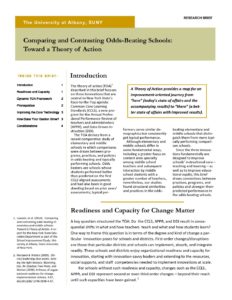
The Common Core Odds-Beating Studies were developed in collaboration between a team of researchers at the University at Albany and the New York State Education Department. The study began in the recognition that there was a need for research investigating the process and practices in schools with relatively better outcomes on the Common Core-aligned assessments first implemented in the state in the 2011-2012 school year. At the time of this study, there had been no systematic examinations of the ways a variety of schools have approached and responded to the Common Core Learning Standards (CCLS) and the Annual Professional Performance Review (APPR) systems, both part of the Race to the Top reform agenda.
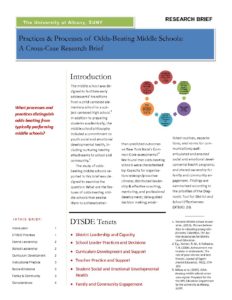
This case is one part of a comparative study of New York State middle schools designed to investigate implementation of Common Core Learning Standards (CCLS) and the Annual Professional Performance Review (APPR) as they relate to student performance outcomes on CCLS-aligned assessments. The study sample included both odds-beating and typically performing schools.
The Common Core Odds-Beating Studies were developed in collaboration between a team of researchers at the University at Albany and the New York State Education Department. The study began in the recognition that there was a need for research investigating the process and practices in schools with relatively better outcomes on the Common Core-aligned assessments first implemented in the state in the 2011-2012 school year. At the time of this study, there had been no systematic examinations of the ways a variety of schools have approached and responded to the Common Core Learning Standards (CCLS) and the Annual Professional Performance Review (APPR) systems, both part of the Race to the Top reform agenda.
A systematic examination of the ways a variety of schools have approached and responded to the Common Core Learning Standards (CCLS) and the Annual Professional Performance Review (APPR) systems, both part of the Race to the Top reform agenda.
The Common Core Odds-Beating Studies were developed in collaboration between a team of researchers at the University at Albany and the New York State Education Department. The study began in the recognition that there was a need for research investigating the process and practices in schools with relatively better outcomes on the Common Core-aligned assessments first implemented in the state in the 2011-2012 school year. At the time of this study, there had been no systematic examinations of the ways a variety of schools have approached and responded to the Common Core Learning Standards (CCLS) and the Annual Professional Performance Review (APPR) systems, both part of the Race to the Top reform agenda.
This presentation describes the COMPASS process: (1) COMPare practices to higher performers; (2) Assess priorities; (3) Select potential levers to improve; (4) Set SMART goals. And then AIM process: (1) Action planning; (2) Implementation; and (3) Monitoring progress.
This presentation describes the COMPASS process: (1) COMPare practices to higher performers; (2) Assess priorities; (3) Select potential levers to improve; (4) Set SMART goals. And then AIM process: (1) Action planning; (2) Implementation; and (3) Monitoring progress.
This presentation presents findings that in high schools with higher than expected graduation rates, educators are looking beyond graduation to students’ post-secondary needs, and meeting those needs with clear goals, strong relationships, individual attention, and flexibility.
This presentation presents findings that in high schools with higher than expected graduation rates, educators are looking beyond graduation to students’ post-secondary needs, and meeting those needs with clear goals, strong relationships, individual attention, and flexibility.
This presentation presents findings that in high schools with higher than expected graduation rates, educators are looking beyond graduation to students’ post-secondary needs, and meeting those needs with clear goals, strong relationships, individual attention, and flexibility.
This presentation presents findings that in high schools with higher than expected graduation rates, educators are looking beyond graduation to students’ post-secondary needs, and meeting those needs with clear goals, strong relationships, individual attention, and flexibility.
This case is one part of a comparative study of New York State elementary schools designed to investigate implementation of Common Core Learning Standards (CCLS) and the Annual Professional Performance Review (APPR) as they relate to student performance outcomes on CCLS-aligned assessments. The study sample included both odds-beating and typically performing schools.
The Common Core Odds-Beating Studies were developed in collaboration between a team of researchers at the University at Albany and the New York State Education Department. The study began in the recognition that there was a need for research investigating the process and practices in schools with relatively better outcomes on the Common Core-aligned assessments first implemented in the state in the 2011-2012 school year. At the time of this study, there had been no systematic examinations of the ways a variety of schools have approached and responded to the Common Core Learning Standards (CCLS) and the Annual Professional Performance Review (APPR) systems, both part of the Race to the Top reform agenda.
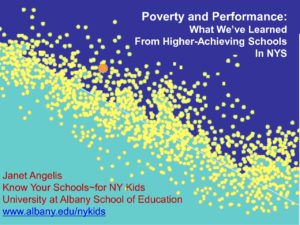
This article discusses findings across studies of higher performing schools since 2005.

Since 2005, NYKids has conducted six such studies spanning elementary through high school, with some looking at specific instructional contexts (e.g. science classrooms) and others at particular groups of students (ethnic and linguistic minority and special needs). NYKids have found that the higher-performing schools in each study share some common characteristics that distinguish them from schools with typical performance. Across all the studies, NYKids found that in the higher performers, educators collaboratively use data to drive decisions about curriculum and instruction with the goal of ensuring that every student can and will learn; in addition, they take the stance that “poverty is no excuse” for poor student performance.
In a new study, a team from the University at Albany’s School of Education examined high school completion.
In a new study, a team from the University at Albany’s School of Education examined high school completion by studying eight high schools with consistently higher than predicted graduation rates among at least two groups of students generally considered at risk of failing to complete high school. These were compared with five demographically similar schools that consistently achieved average graduation rates among the same groups.
Discussion of findings from rural high schools that graduate students at higher rates than comparison districts.
What are the qualities of classrooms, school, and district processes and practices in rural high schools with higher-than-average graduation rates? How do these processes and practices compare with rural high schools with histories of average graduation rates? In this study, six schools were sampled for a multiple case study of rural high school completion. Four had higher-than-average graduation rates, while two had average rates. All six schools were visited by site teams who conducted 63 interviews and collected documentary evidence of practices and processes related to high school graduation. Key findings include on graduation rate success include: (1) the qualities of academic goals and learning opportunities; (2) the nature of individual and a collective educator efficacy; (3) the strategies educators used to develop and maintain family relationships and engage community members; and (4) mechanisms for adapting instruction and employing interventions for students at risk of dropping out.
A case study report from an investigation of 13 high schools; eight of these schools had consistently higher than predicted graduation rates among at least two critical needs groups and five consistently achieved average graduation rates, given their student demographics.
This case study is one of a series of studies conducted by Know Your Schools~for NY Kids since 2005. In 2012-13, research teams investigated 13 high schools; eight of these schools had consistently higher than predicted graduation rates among at least two critical needs groups and five consistently achieved average graduation rates, given their student demographics. Schools were selected based on the four-year graduation rates for cohorts of 2004, 2005, and 2006, as reported on their state report cards in 2009-11. Researchers used site-based interviews of teachers and administrators, as well as analyses of supportive documentation, to determine differences in practices between higher- and average-performing schools in the sample.
An investigation of 13 high schools; eight of these schools had consistently higher than predicted graduation rates among at least two critical needs groups and five consistently achieved average graduation rates, given their student demographics.
In 2012-13, research teams investigated 13 high schools; eight of these schools had consistently higher than predicted graduation rates among at least two critical needs groups and five consistently achieved average graduation rates, given their student demographics. Schools were selected based on the four-year graduation rates for cohorts of 2004, 2005, and 2006, as reported on their state report cards in 2009-11. Researchers used site-based interviews of teachers and administrators, as well as analyses of supportive documentation, to determine differences in practices between higher- and average-performing schools in the sample.
A case study report from an investigation of 13 high schools; eight of these schools had consistently higher than predicted graduation rates among at least two critical needs groups and five consistently achieved average graduation rates, given their student demographics.
This case study is one of a series of studies conducted by Know Your Schools~for NY Kids since 2005. In 2012-13, research teams investigated 13 high schools; eight of these schools had consistently higher than predicted graduation rates among at least two critical needs groups and five consistently achieved average graduation rates, given their student demographics. Schools were selected based on the four-year graduation rates for cohorts of 2004, 2005, and 2006, as reported on their state report cards in 2009-11. Researchers used site-based interviews of teachers and administrators, as well as analyses of supportive documentation, to determine differences in practices between higher- and average-performing schools in the sample.
This presentation discusses the best practices of elementary schools that outperform others among populations of critical needs students, such as those living in poverty.
This presentation discusses the best practices of elementary schools that outperform others among populations of critical needs students, such as those living in poverty.
A case study report from an investigation of 13 high schools; eight of these schools had consistently higher than predicted graduation rates among at least two critical needs groups and five consistently achieved average graduation rates, given their student demographics.
This case study is one of a series of studies conducted by Know Your Schools~for NY Kids since 2005. In 2012-13, research teams investigated 13 high schools; eight of these schools had consistently higher than predicted graduation rates among at least two critical needs groups and five consistently achieved average graduation rates, given their student demographics. Schools were selected based on the four-year graduation rates for cohorts of 2004, 2005, and 2006, as reported on their state report cards in 2009-11. Researchers used site-based interviews of teachers and administrators, as well as analyses of supportive documentation, to determine differences in practices between higher- and average-performing schools in the sample.
This presentation presents the findings of “beating the odds” schools. Selection of the schools is based on 3 years of NYS Assessment results. Researchers conduct two-day site visits, and analyze the data looking for differences in practice.
This presentation presents the findings of “beating the odds” schools. Selection of the schools is based on 3 years of NYS Assessment results. Researchers conduct two-day site visits, and analyze the data looking for differences in practice.