Publication Year: 2013
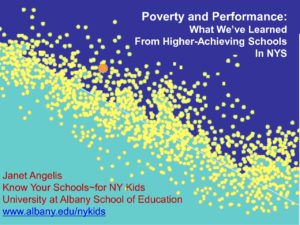
This presentation presents the findings of “beating the odds” schools. Selection of the schools is based on 3 years of NYS Assessment results. Researchers conduct two-day site visits, and analyze the data looking for differences in practice.
This presentation presents the findings of “beating the odds” schools. Selection of the schools is based on 3 years of NYS Assessment results. Researchers conduct two-day site visits, and analyze the data looking for differences in practice.
A case study report from an investigation of 13 high schools; eight of these schools had consistently higher than predicted graduation rates among at least two critical needs groups and five consistently achieved average graduation rates, given their student demographics.
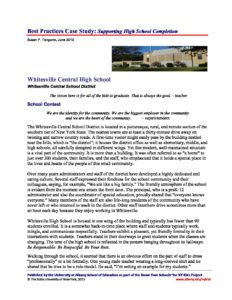
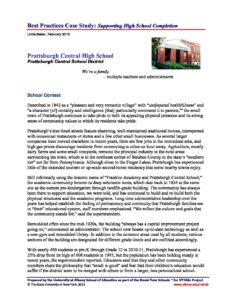
This case study is one of a series of studies conducted by Know Your Schools~for NY Kids since 2005. In 2012-13, research teams investigated 13 high schools; eight of these schools had consistently higher than predicted graduation rates among at least two critical needs groups and five consistently achieved average graduation rates, given their student demographics. Schools were selected based on the four-year graduation rates for cohorts of 2004, 2005, and 2006, as reported on their state report cards in 2009-11. Researchers used site-based interviews of teachers and administrators, as well as analyses of supportive documentation, to determine differences in practices between higher- and average-performing schools in the sample.
An investigation of 13 high schools; eight of these schools had consistently higher than predicted graduation rates among at least two critical needs groups and five consistently achieved average graduation rates, given their student demographics.
In 2012-13, research teams investigated 13 high schools; eight of these schools had consistently higher than predicted graduation rates among at least two critical needs groups and five consistently achieved average graduation rates, given their student demographics. Schools were selected based on the four-year graduation rates for cohorts of 2004, 2005, and 2006, as reported on their state report cards in 2009-11. Researchers used site-based interviews of teachers and administrators, as well as analyses of supportive documentation, to determine differences in practices between higher- and average-performing schools in the sample.
A case study report from an investigation of 13 high schools; eight of these schools had consistently higher than predicted graduation rates among at least two critical needs groups and five consistently achieved average graduation rates, given their student demographics.
This case study is one of a series of studies conducted by Know Your Schools~for NY Kids since 2005. In 2012-13, research teams investigated 13 high schools; eight of these schools had consistently higher than predicted graduation rates among at least two critical needs groups and five consistently achieved average graduation rates, given their student demographics. Schools were selected based on the four-year graduation rates for cohorts of 2004, 2005, and 2006, as reported on their state report cards in 2009-11. Researchers used site-based interviews of teachers and administrators, as well as analyses of supportive documentation, to determine differences in practices between higher- and average-performing schools in the sample.
This presentation discusses the best practices of elementary schools that outperform others among populations of critical needs students, such as those living in poverty.
This presentation discusses the best practices of elementary schools that outperform others among populations of critical needs students, such as those living in poverty.

