What is an Odds-Beater?
By Kathryn S. Schiller, Co-Investigator, Catherine Kramer, Research Assistant, and Kristen C. Wilcox, Director of Research and Development
Since 2004, NYKids has studied elementary, middle, and high schools that beat the odds in terms of student outcomes. Each study addresses a different set of research questions. Different outcome measures for different student populations are used. So, what is common about odds-beaters and how are they identified?
Measures of Odds-Beating Performance
One thing is constant in NYKids’ method of identifying odds-beaters: Odds-beaters are always performing better than expected among particular subgroups of students and this performance is a pattern (i.e. trend over time).
(1) Academic Performance: Academic performance on all major content area assessments as well as graduation rates are reported by the New York State Education Department.
In the college and career readiness study, academic performance was measured by the percentage of high school students earning a Regents or Advanced Regents diploma. Both diplomas indicate that graduates have met or exceeded the state standards. Advanced Regents indicating more rigorous course taking.
(2) Subgroups: Since NYKids’ mission is to address outcome disparities through research and research-practice improvements, studies are designed to identify variation in performance.
In the college and career readiness study, subgroups of interest included African American/Black, Hispanic/Latino, English language learners and those who are economically disadvantaged.

(3) Patterns: Because performance data can fluctuate for a variety of reasons, at least two years of performance data are used when identifying odds-beaters.
In the college and career readiness study, graduation rates were obtained for three successive cohorts of 9th graders – 2010, 2011 and 2012.
Identifying Odds-Beaters
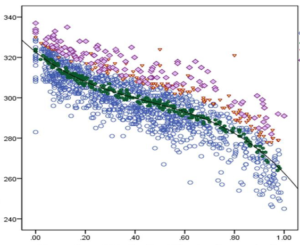
The selected indicators for odds-beating performance (i.e. rates of Regents and Advanced Regents Diplomas) across the selected subgroups for all public (non-charter) secondary schools across New York State were analyzed using a procedure called regression analysis (see the Methods and Procedures Report for more detail) .
Regression analysis facilitates estimating the expected performance across subgroups. To ensure accuracy, multiple snapshots of graduation rates were considered. Rates were considered for both Regents and Advanced Regents across multiple different cohorts of students. This captures trends rather than random momentary events. Altogether, a total of 30 indicators of performance were considered.
Differentiating Odds-Beaters from Typical Performers
The overall performance for each school was calculated by averaging the gaps between the expected and actual performance for each of these 30 indicators. Many schools did not have data for all 30 indicators because they did not have enough students from each subgroup. For these schools their average was based on fewer than 30 indicators.
Contrast is always desirable in studies intended to identify what differentiates one sample from another. For this reason, schools that perform as expected and those that perform better than expected were sought. Schools that had an overall score around 0 performed almost exactly as expected. These schools are classified as “typical” performers. Schools with a score around 1 or above, indicating statistically significant better performance for the subgroups identified, were classified as odds-beaters. Lower performing schools were not studied as the contrast between typically performing and odds-beating already offers the contrast sought and lower performing schools often are undergoing interventions making research involvement an undue burden.
Selection of Odds-Beating Schools to Study
From this sample, a set of seven odds-beaters and three typically performing schools were selected. Consideration was given to selecting a group of schools that are geographically distributed across the State. A balance was struck between schools that are in rural, suburban and urban communities. Other characteristics about schools such as size of population served, wealth rations, and expenditures per pupil were taken into consideration.
