The Trajectory of Graduation Rates in the College and Career Readiness Student Study
By Lisa Yu
By July 2020, NYKids researchers will have completed all data collection for the College and Career Readiness student study that began in the fall of 2019. Based on others’ research as well as the first phase of the College and Career Readiness Study, this study is informed by three frameworks:
- Positive youth development: a strengths-based, developmentally informed framework that takes the view that young people are more than their school-defined roles as students.
- Critical and culturally-relevant, responsive, and sustaining pedagogy: approaches that reflect and leverage young people’s lived experiences and empower them to use school-based knowledge to effect change in their own lives as well as their communities.
- Social identity and agency: frameworks that provide a lens into how young people make sense of their experiences at school and their emerging identities as learners and citizens.
Through these lenses, NYKids researchers have sought to understand youths’ experiences and perspectives on school and have focused attention on two of the four schools in the study where we were able to collect complete data sets despite the Covid-19 evoked school closures: these schools are Crown Point Central School and Malverne Senior High School.
A criterion to select Crown Point and Malverne in the phase one study was that both schools had achieved a pattern of better-than-predicted graduation rates for three successive cohorts of 9th graders – 2010, 2011 and 2012. Their graduation outcomes among African American/Black, Hispanic/Latino, English language learners, and/or economically disadvantaged students were significantly better than schools of similar demographics in New York state.
In the phase two/student study, we tracked the performance trajectory of Crown Point and Malverne by comparing their graduation rates over multiple years. For the sake of consistency and validity, we continued using an average graduation rate of three successive years as the metric for comparison instead of a graduate rate of one individual year that might represent an anomaly.
We analyzed the graduation rates of four cohorts of 9th graders: cohort 1 included 9th graders who started high school in the years 2010-2012; cohort 2 included 9th graders who started in the years 2011-2013; cohort 3 included 9th graders who started school in the years 2012-2014; and cohort 4 included 9th graders who started high school in the years 2013-2015.
The Results: Better Begets Better
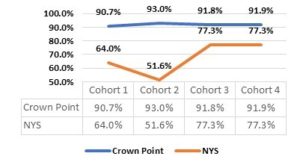
Crown Point Central School has maintained a higher graduation rate when compared to the New York State average rate since 2014. With a comparison of the four cohorts mentioned above; the overall graduation rate in Crown Point has also ascended from 90.7% for Cohort 1 to 91.9% for Cohort 4.
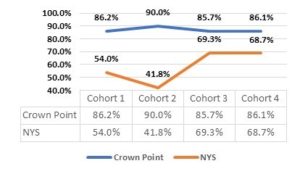
Regarding subgroup comparisons and focusing specifically on youth living in poverty, Figure 2 shows that the three-year graduation rate of economically disadvantaged students has remained relatively stable despite a minor dip from 86.2% for Cohort 1 to 85.7% for Cohort 3. It then climbed to 86.1% in the next three years for Cohort 4.
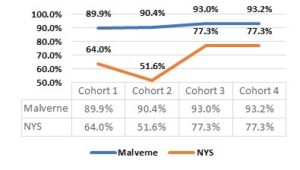
Like Crown Point, the overall graduation rates in Malverne have exceeded the New York state average for all four cohorts of 9th graders. It has also increased slightly from a rate of 89.9% for Cohort 1 to 93.2% for Cohort 4.
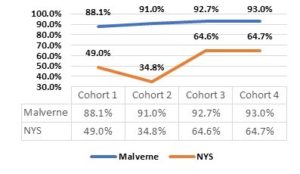
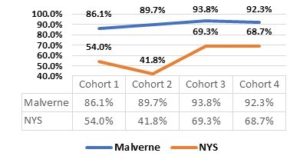
This upward trend also extends to subgroups of students including African American and economically disadvantaged students. The graduation rate of African American students in Malverne has risen steadily since 2014 and has been substantially higher than the New York state rate for all four cohorts. Likewise, the graduation rate of economically disadvantaged students has gone up from 86.1% for Cohort 1 to 92.3% for Cohort 4, and has showed a better performance than the state average rates for all four cohorts.
For more information about the two focal schools, please read our previous blogs about our site visits to Crown Point Central School and Malverne Senior High School. See the phase one study cross-case report and case studies of Crown Point and Malverne as well. Stay tuned for more findings from the student study in the coming months.
Finally, if you’d like to know more about how to use NYKids findings and NYKids improvement tools (called COMPASS) for your own school improvement efforts sign up for our upcoming improvement institutes at https://bit.ly/NYKidsImprovement.
