Achievement and Opportunity Gaps Have Persisted for 50 Years Claims New Report
by Aaron Leo and Kristen C. Wilcox
A recent report released by the National Bureau of Economic Research makes an alarming claim: the socioeconomic achievement gap hasn’t budged in fifty years.
The authors base their findings on five decades of data from four testing programs: two that are part of the National Assessment of Educational Progress (NAEP), the International Mathematics and Science Study (TIMSS), and the Program for International Student Assessment (PISA). They conclude that “the opportunity gap—that is, the relationship between socioeconomic status and achievement—has not grown over the past 50 years. But neither has it closed.”
Why has this gap persisted despite waves of reforms intended to extend opportunity to children and youth growing up in poverty? The authors propose that part of the answer to this question lies in family and school factors. In regards to factors related to family income, the authors explain that the higher level of overall educational attainment in the U.S. has been offset by growing socioeconomic disparities in the last several decades.
Schools, too, have been subject to opposing forces. The authors explain that while federal legislation has sought to provide more equitable funding to higher poverty school districts across the country, the quality of the teaching force in higher poverty schools and districts has declined. This is attributed, in part, to the declining relative wages offered to educators.
Visualizing Achievement Gaps with the NYKids Performance Tracker
While this report’s findings point to enduring and troubling trends with regard to educational opportunities for children growing up in poverty, fortunately, some schools show evidence of narrowing achievement gaps and doing so successfully over time.
NYKids has spent over a decade studying such “odds-beating” schools and provides resources to visualize gaps and identify targets to close gaps.
As part of a series of blogs on the NYKids Know Your Schools Performance Tracker, here we focus on the Opportunity Gap tool which can be used to visualize performance gaps and help users set targets for closing those gaps.
How to Get Started
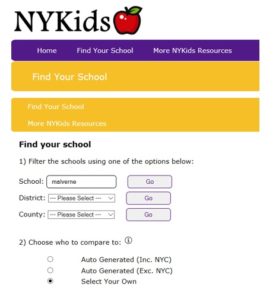
When you arrive at the Know Your Schools database home page you will see three options to begin your search:
- School
- District
- County
You will also see three comparison options:
- Auto generated (including New York City [NYC])
- Auto generated (excluding NYC)
- Select your own (The select your own option will prompt you with the same three search options: school, district, or county and its here that you can make some choices based on your own knowledge of and interest in other schools.)

What the Opportunity Gap Chart Does
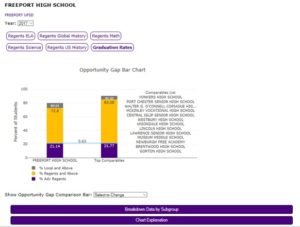
The Opportunity Gap Bar Chart shows how a selected school compares to schools that serve students who are equally or more economically disadvantaged. Users may compare their chosen school against top comparables using the following metrics:
Regents ELA test scores
Regents Global History test scores
Regents Math scores
Regents Science scores
Regents US History scores, and
Graduation rates
In this example, we chose to highlight the Advanced Regents Graduation rates for Freeport High School—one of the odds-beaters we identified in the NYKids’ College and Career Readiness Study based on their Regents and Advanced Regents outcomes for African-American/Black; Hispanic/Latino; English language learners; and economically disadvantaged students. This chart shows how Freeport is on par with top comparables in the state for Advanced Regents graduation rates among economically disadvantaged students.

Subgroup Breakdowns
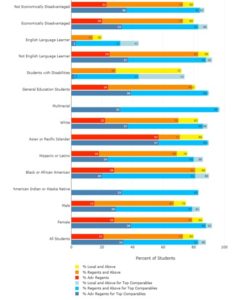
To take the analysis a step further, you can refine comparisons by clicking “Breakdown Data by Subgroup” to see how various subpopulations fare in a chosen school in comparison to top comparables.

It is important to note that state test scores and graduation rates tell only a piece of the school’s story. These metrics are inevitably limited in what they can tell us about how kids are developing into well-rounded, academically prepared, and emotionally and socially healthy people. They also tell us little about the many things professionals in schools do to contribute to their communities including partnering with families and private and public sector agencies.
Nevertheless, the opportunity gap chart can be a powerful tool to help set student subgroup performance targets and find other schools to reach out to get insight into promising practices to close the persistent gaps described in the NBER report.
We invite you to delve into the opportunity gap tool and consider: Where are our most pronounced gaps? What targets can we set to begin closing those gaps? and What is happening in schools like ours that have closed gaps?
For great ideas on how to close achievement and opportunity gaps in your chosen school…
- Check out what odds beaters like Freeport have done to close achievement gaps among youth growing up in poverty.
- Search for other schools of interest to you in the NYKids Research Results page where dozens of case studies delve into the nitty gritty of how educators across NYS have addressed outcome disparities.
- Get direct assistance from NYKids and our partners (CASDA and BOCES) for help with using the suite of NYKids improvement resources.
Tag:Achievement gap
